
Converting Patient Data Into Real-Time Analysis
Edited by John Morrissey
EHRs have generated massive amounts of useful patient data, but sifting through these data sets to identify trends that provide actionable information is next to impossible without the right tools. Today’s BI and analytics technologies help providers make sense of their data and improve outcomes.
EHR adoption was all about getting patient data in electronic format, but doing so was no easy feat. The first national coordinator of health IT, Dr. David Brailer, released a “framework for strategic action” in 2004 giving adopters of EHRs some encouraging direction, but the prospect of widespread penetration within a decade was not encouraging at all. In physician offices and hospitals, the rate of adoption was in the single digits. But by May of this year, the Office of the National Coordinator reported more than half of all eligible professionals and 80 percent of hospitals had adopted and are demonstrating meaningful use of an EHR.
With discrete data now routinely available, the next step is being able to aggregate and measure this data for operational, financial, and performance improvements. Where does a provider start? What makes the most sense for your facility? In this industry roundtable, key leaders from three health systems discuss their technology approaches to sifting through and analyzing data, what to measure first and why, and early results.
Ronda Dulbandzhyan is director of systems integration and databases for the enterprise information services unit at Cedars-Sinai Health System, Los Angeles, an academic medical center and 120-physician (primary- and specialty-care) group. John Kenagy is senior VP and CIO of Legacy Health, with six hospitals, 21 primary-care locations, and 20 specialty clinics in and around Portland, OR. Michael Thompson is director of business intelligence/data architecture for Children’s Hospital of Atlanta, with three inpatient facilities and 20 clinical locations.
Q: What BI/analytics tools are you currently leveraging in your healthcare facility?
Dulbandzhyan: Cedars-Sinai is using the Health Care DataWorks (HCD) platform. We’ve had a financial-based data warehouse since the 1990s, and we went live with Epic as an electronic health record system in 2009, then live with CPOE in March of 2011. Our agreement with HCD went into effect in July 2012.
Kenagy: Legacy is an Epic customer. We use Strata Decision for budgeting and cost-accounting, we have our patient-satisfaction surveys, and we use Premier for benchmarking. We use the Epic Clarity and Reporting Workbench for regular operating reports. Clarity is a good tool for someone who is fairly technical and understands the data and the tool, but we needed to offer analytical tools directly to clinicians. We chose Explorys for that purpose.
Thompson: We leverage Oracle, Microsoft, and QlikView as our primary BI tools.
Q: What were the drivers behind these investments?
Dulbandzhyan: As we’ve rolled out each Epic module, we’ve created more and more clinical data that we’ve never had before. We’ve known for three to five years that our clinical folks just aren’t getting all the data and analytics they need at their fingertips. Our clinicians wanted to be able to make real-time decisions for patient treatment and care flows. Maybe someday those will come out of Epic, but our Epic team and implementation aren’t ready to take on that task at this point.
One of our requirements was real-time HL7 interfaces, and HCD was willing to work with us to develop those. Our goal for lab dashboards is statistics in under five minutes. We’re working to improve the performance, but right now, we’re at about 15 to 20 minutes.
Kenagy: First, I wanted to get the data quickly to my decision makers — clinicians, care managers, overall managers. I didn’t want to experience the common delays of a traditional data warehouse implementation where you buy a database, hire people, pull a model together, and two years from now you can create your first report. Second, we wanted to build on our EHR a BI solution that worked seamlessly with Epic and didn’t involve our having to start from zero. The third driver was our need to aggregate populations, something we can’t do now very easily with Epic. Finally, we wanted an easy way of doing internal and external benchmarks.
Explorys takes the data from Clarity, so we build on EHR investment that we put so much time, energy, and attention into. Explorys is basically “a can opener” to Clarity that allows the democratization of analytics.
Thompson: In general, a BI technology strategy is built on data collection, data transformation, data storage, and data access/presentation. We use Oracle for data collection, transformation, and storage; we use QlikView and Microsoft for data collection, transformation, storage, and data access/presentation. The end user is the driver of our BI toolsets, but different types of users will approach them differently, so we have to keep that in mind. I tend to classify users into three categories: farmers, investigators, and explorers. Farmers have a predefined data need, which is generally routinely accessed and answers a predefined question. They’re usually satisfied with a static reporting tool. Investigators have a hypothesis in mind; they look for a root cause and repeating data patterns. They want to ask a question, receive data, and ask another question, repeatedly. They need ad-hoc query, drill-down, and visual analysis that provides quick feedback. Explorers are die-hard experimentalists who interact with large data sets, searching for relationships rather than occurrences. Often their requirements are totally unknown. They say, “I want it all, don’t hold back.” These users require a data explorer tool that can handle large-volume data sets, segmentation analysis, and data mining.
Q: How did you prioritize the data you needed to measure/analyze?
Dulbandzhyan: We met with all of our clinical departments and asked them, “If you could wave your magic wand and have whatever data you wanted, what data would be most important to you that you don’t have today?” We ranked their responses and came up, first, with real-time analytics on medication, labs, problem lists, and relationships with physicians. Then we identified that they wanted that same information just in relation to costs and charges.
We have care plans, decided upon by the organization, that should be followed to quickly make the patient better. Clinicians wanted to fill gaps in information through reports that, if presented in a real-time or a near-real-time dashboard, would help them say, “Hey, did you notice that this patient has X, Y, and Z, and since they have those, we need to get them on that care plan.”
Kenagy: The first group we automated with Explorys was our patient-centered health homes. Our physicians and care managers are actively using data to identify patients who benefit from additional disease management services. For example, we’re doing great on the diabetics we see — the best-practice alerts that come in through Epic — but what about diabetic patients who are part of the panel who haven’t been seen in the last six months? We’re using Explorys to reach them.
We have a BI workgroup that includes operational and clinical leaders and informatics leaders. That group is working on the prioritization for what’s next. One important aspect of this is not only what information to access first, but also who gets access. People who get to work with Explorys first have to show a hunger for information, a willingness to roll up their sleeves. It’s not like, “I want a report; email it to me in two weeks when it’s done.” Explorys is not giving you a fish; it’s teaching you to fish.
Thompson: Prioritization of business/clinical initiatives using EMR data begins with identifying the key questions often asked by providers but not easily answered. In my conversations with leaders, the strategic data questions fall into the following areas: understanding who we are caring for, what care to focus on, who is providing that care and when, where care is being provided, and how effective and efficient that care is. System scorecards and metrics around each of these areas drive most BI/CI dashboards and data-discovery applications.
But be careful. Once you provide help to navigate the sea of data, the tidal wave of demands for information begins. Success in gaining access to data is both a blessing and a curse. Organizations need to think beyond a tools strategy to a data-enablement strategy supported by a tool foundation. This is where self-service data-discovery tools like QlikView play an important role. They let users create analytical queries while freeing up IT staff to focus on other tasks, potentially benefiting both groups.
Q: What results have you experienced to date in your use of BI/analytics tools?
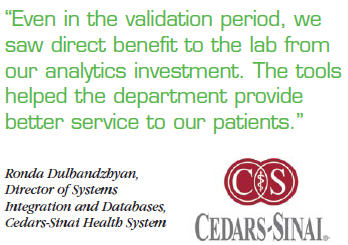
Dulbandzhyan: One of the very first results was reports on overdue labs. Our dashboard basically presents to the lab managers what tests they have committed to, the turnaround time, and where they have missed meeting that turnaround time. Even in the validation period, we saw direct benefit to the lab in its ability to provide better service for our patients. We were sitting in a meeting with someone who was reviewing the dashboards, and up pops an overdue test. He immediately got on the phone, contacted someone in the area where that test would be performed, and said, “What’s up with this? Where are we? What’s going on?”
Lab managers can manage productivity better in near real time. In the past they did have access to this data from various sources, but they had to pull it together. It took a lot of time out of their work schedules to do that; they would only do it monthly or quarterly. By having the data at their fingertips, they’re finding it’s beneficial because they can quickly react and change staffing. The staff knows that it’s right there now, showing what they’re doing.
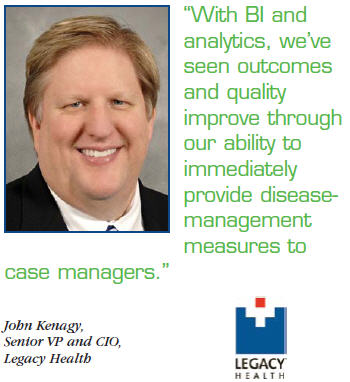
Kenagy: One of our driving factors was improving time-to-value — the ability to sign a contract, work with a group, curate the data, and get it in the hands of people who need it. We’ve seen outcomes and quality improve as a result of being able to immediately provide disease-management measures to case managers. It’s data at their fingertips; they run it. It’s not a report that’s given to them; they look it up. They look at their panel versus others, and they look at us versus other data in the whole Explorys world — more than 200 hospitals report into the system.
Q: What BI/analytics advice/best practices can you offer other providers?
Dulbandzhyan: As you set up your tool, make sure your team takes the time to create standards, which should include environment and code-naming standards; development change management, including a quality-assurance step; a consistent look and feel for reports; and standard functionality and branding for dashboards.
Kenagy: My advice — don’t do analytics on your own. Tap the wisdom of many other people. That may seem heretical to places that are building a data warehouse from the ground up, but our approach is to work with vendors strategically. People aren’t building their own EHRs anymore (within health care systems). For us, it’s the same model for analytics. Also, get tools in the hands of people who have questions. Don’t be afraid of that democratization.
Thompson: It is important you develop a best practice around your information delivery approach. The typical conversation we have when developing metrics sounds like the Abbott and Costello routine. The BI requirements analyst asks the user, “What data do you want?” The user responds, “What data do you have?” The conversation spirals from there. To resolve the “chicken-and-egg” dilemma, it is important to develop an engagement process with the users whereby you can extract the questions they want to answer, marrying the answer to the data you have available, preferably in a short amount of time between when the question is asked and the data delivered.
This is a process methodology and a tool methodology. Before building a BI application, the BI team must establish a tool that allows the end user to learn about the data available. The more immersed the end user becomes in understanding the data, the more intelligent the questions. This requires a tool that easily consolidates and associates in a way that allows the user to easily analyze data to find the “aha” moment.
Q: What has been the toughest challenge in adopting BI/analytics tools? How have you addressed this challenge?
Dulbandzhyan: Since many of our application vendors provided their own BI toolsets, our challenge was supporting all of them. In 2005, after a re-evaluation, we selected SAP’s Business Objects. Many of our vendors also leveraged the SAP toolset. But it was very challenging to migrate folks from one BI tool to the new one, since their analysts were talented in using the older tools. As we leveraged the new tool’s functionality, the news spread, and demand for SAP’s Business Objects grew. It did take a couple of years to migrate all the analysts from the old tool.
Kenagy: Honestly, one barrier was my own IT department. There was a whiff of paternalism with a few IT analysts. I would hear statements such as, “Doctors aren’t going to be able to understand that information. Epic data is so complex. How are we going to know they interpret the right thing?” It doesn’t matter! If they misinterpret something, we’ll help them out. The IT staff ’s job is going to transform to managing information rather than running reports.
We’re still doing a huge amount of clarity reporting, but the BI team actually goes to Explorys first because the tools are just so easy to use. Then they build their report. If people still want it within their workflow, we’ll build it in Epic. But we’ll do the proof of concept in Explorys. It’s fascinating; the people who were a little resistant are now fully embracing it.
Thompson: Many tools languish because it is assumed that once you identify and purchase the tool, “magic happens,” and all users will accept its capabilities. The reality is that the BI team must move quickly to develop expertise with the tool. Otherwise, it is analogous to buying a 747 jetliner and using it to drive five miles to the grocery store. What a waste! You must develop your staff with zealots who believe the tool is the answer to all of life’s questions — searching for opportunities to prove the tool’s worth and value at every turn.
Adoption also requires that users trust the data. The perception that the tool has poor or incorrect data is a stake in the heart of the BI tool. Users need to know that the data being presented is derived from a qualified source. I prefer BI tools that allow you to seamlessly drill through the aggregate into the atomic-level data, as opposed to tools that only provide data in the aggregate. Adoption occurs faster when users know that aggregate can be proofed out.
Q: How do you plan on expanding your use of BI/analytics in the future?
Dulbandzhyan: We’re going live with our physician billing module this summer, and we’ll quickly follow that up with bringing our ambulatory group into this data warehouse. In California we have key areas to measure like mammogram and colonoscopy compliance. To be able to resolve those reporting needs by fall, we’re also bringing in imaging and pharmacy. We brought in our inpatient lab system, but the ambulatory team works with Quest and LabCorp, so we’re bringing in those systems as well. We’re trying to quickly close the gaps on all the major clinical areas, and then we’re looking to bring in all of our financial data within the next 12 months. To us, that’s almost the complete picture.
Kenagy: We are planning exponential growth: horizontally, to continue rolling out the analytical tools to new people, and vertically, to add more sources of data. The next big thing is to take our clinical and outcomes data and match it to the cost, all by gathering the data in Explorys and using its analytical capabilities. Claims data is next. We don’t do a lot of claims analysis; we are not a risk-accepting organization, and we don’t have our own health plan. But we are doing a lot more agreements around accountable care where claims data will be really important.
Thompson: Today, BI tools are used as a history book — showing data from the past in a descriptive manner as to what has happened. The future of BI in healthcare can be found in two major focus areas: predictive analytics and Big Data, which are not mutually exclusive. As predictive analytics and data mining increase, the need for ingesting a variety of data in large volumes will become key drivers of data analytics.
Predictive analytics is the capstone of the journey from understanding data to quantitative efforts to predict things that have not happened yet. Big Data is often described as driven by the three V’s: variety, volume, and velocity. BI Tools will need to handle the three V’s in a manner accepted by the end users of the data.